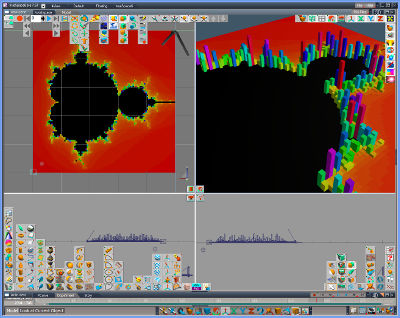
Mandelbrot plot (2002)

Author's sample script, wroks, hints.
Post Reply
User avatar
3DfromNULL
Site Admin
Posts: 45
Joined: 2018-Jul-13 9:35

Mandelbrot plot (2002)

Post by 3DfromNULL »

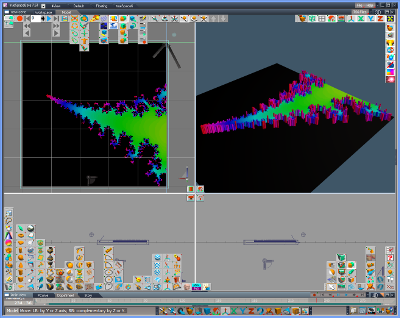
This script gives a demonstration of plotting Mandelbrot set and coloring trueSpace (tS) objects. Each pixel's color and height are calculated by x and y coordinates of the point using Python's "complex" type. To get a spectrum of color in RGB, the script uses hsv_to_rgb() of "colorsys" standard module.

Image

You may change some parameter for the range, precision, etc. to get result you want, but too high precision may cause tS crash.
Image

edited on Mar 12 2019:
This script cannot run with Python2. Please use ptsxpy-for-Python3.
Updated the attached script file, 1b->1c so that it can be run with ptsxpy 0.0.7.

Image
Image Image Image Image Image
Attachments
mandel1c.py
script file
(2.63 KiB) Downloaded 2369 times
Post Reply